Hello, here is my solution to the Task 2 of the Week 75 of the Weekly Challenge solved in the Raku programming language.
Largest Rectangle Histogram
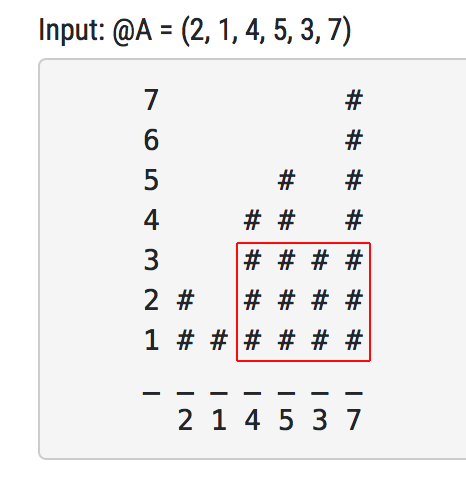
You are given an array of positive numbers @A.
Write a script to find the largest rectangle histogram created by the given array.
The following visualisation illustrates the task. The goal is to build a histogram with the values from the input and to find the rectangle with the maximum area.
My current solution is quite straightforward. Just scan all the possible positions and all possible widths of the potential rectangle, find its maximum possible height and compute the area.
my @hist = 3, 2, 3, 5, 7, 5;

my $max = 0;
my @max;

for ^@hist -> $start {
    for $start ^..^ @hist -> $end {
        my $area = min(@hist[$start .. $end]) * (1 + $end - $start);
        say "$start..$end = $area";
        if $area > $max {
            $max = $area;
            @max = $start, $end;
        }
    }
}

say "The biggest rectangle is between the columns @max[0] and @max[1] and its area is $max.";
* * *
On GitHub, you’ll also find my C++ solution to this task.
Update: a more idiomatic Raku solution.
→ GitHub repository
→ Navigation to the Raku challenges post series
One thought on “Largest Rectangle Histogram: The Raku Challenge Week 75, task 2”